Bring your data to life and create SVG charts with PHP using this lightweight, open-source library. It helps you design stunning visualizations directly in your backend without using JavaScript or external tools.
Whether you’re building a dashboard, creating business reports, or adding analytics to your app, the PHP SVG Charts library makes data visualization fast, responsive, and effortless. Every chart renders crisply on every screen, so your message comes across sharp and professional.
Package Introduction and Installation
The maantje PHP SVG Charts library allows the developer to create several chart types: line, bar, grouped bar, and pie charts directly in PHP. It doesn’t require JavaScript or any other frontend framework; thus, it’s a perfect fit for back-end-generated reports and embedded analytics.
To install it using Composer, run the following command in your terminal:
composer require maantje/chartsOnce installed, you can load the library through the Composer autoloader and begin generating SVG charts instantly.
SVG Line Chart Example In PHP
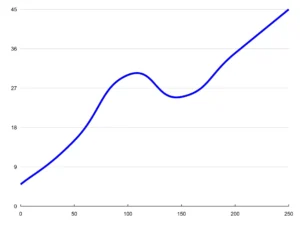
A line chart shows data changes over time in a clean, connected flow. It’s ideal for visualizing monthly revenue, user growth, or performance metrics. You can easily create SVG charts with PHP and save them as scalable visuals ready for embedding in reports or dashboards.
<?php
require __DIR__ . '/vendor/autoload.php';

use Maantje\Charts\Chart;
use Maantje\Charts\Line\Line;
use Maantje\Charts\Line\Lines;
use Maantje\Charts\Line\Point;


$chart = new Chart(
    series: [
        new Lines(
            lines: [
                new Line(
                    points: [
                        new Point(x: 0, y: 5),
                        new Point(x: 50, y: 15),
                        new Point(x: 100, y: 30),
                        new Point(x: 150, y: 25),
                        new Point(x: 200, y: 35),
                        new Point(x: 250, y: 45),
                    ],
                    color: 'blue',
                    curve: 4
                ),
            ]
        ),
    ],
);
$svg = $chart->render();
file_put_contents(__DIR__ . '/line_chart.svg', $svg);
echo $svg;
Output:
Curved Line Chart In PHP
A curved line chart presents smooth data transitions and is useful for representing flowing values like traffic or engagement over time. The PHP SVG Charts library lets you generate these curves precisely while keeping your charts fully responsive.
Let’s take an example fo showing Curved Line Chart in PHP:
<?php
require __DIR__ . '/vendor/autoload.php';

use Maantje\Charts\Chart;
use Maantje\Charts\Line\Line;
use Maantje\Charts\Line\Lines;
use Maantje\Charts\Line\Point;

$chart = new Chart(
    series: [
        new Lines(
            lines: [
                new Line(
                    points: [
                        new Point(x: 0, y: 10),
                        new Point(x: 50, y: 25),
                        new Point(x: 100, y: 20),
                        new Point(x: 150, y: 35),
                        new Point(x: 200, y: 40),
                    ],
                    color: 'red',
                    curve: 8
                ),
            ]
        ),
    ],
);
$svg = $chart->render();
file_put_contents(__DIR__ . '/curved_line_chart.svg', $svg);
echo $svg;
In this examples, we will generate chart to the browser as well as save it to the file. You can see this file into your project directory.
Grouped Bar Chart Example In PHP
Display comparative data easily using grouped bars. This example helps you compare performance between multiple series side by side, like quarterly sales.
<?php
require __DIR__ . '/vendor/autoload.php';

use Maantje\Charts\Chart;
use Maantje\Charts\Bar\Bar;
use Maantje\Charts\Bar\Bars;

$chart = new Chart(
    series: [
        new Bars(
            bars: [
                new Bar(name: 'Q1', value: 120000, color: 'orange'),
                new Bar(name: 'Q2', value: 150000, color: 'green'),
                new Bar(name: 'Q3', value: 180000, color: 'purple'),
                new Bar(name: 'Q4', value: 200000, color: 'red'),
            ]
        ),
        new Bars(
            bars: [
                new Bar(name: 'Q1', value: 100000, color: 'lightblue'),
                new Bar(name: 'Q2', value: 130000, color: 'lightgreen'),
                new Bar(name: 'Q3', value: 160000, color: 'violet'),
                new Bar(name: 'Q4', value: 190000, color: 'pink'),
            ]
        ),
    ],
);

$svg = $chart->render();
file_put_contents(__DIR__ . '/grouped_bar_chart.svg', $svg);
echo $svg;
echo "Grouped bar chart generated successfully: " . __DIR__ . "/grouped_bar_chart.svg";
It will generate chart file as well as show it to the user.

Pie Chart Example Using PHP
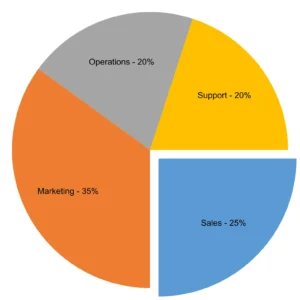
Another popular chart type to show diversified chart is Pie Chart. Turn your data proportions into beautiful, circular visualizations. The pie chart is perfect for showing percentages or category shares visually and interactively.
<?php
require __DIR__ . '/vendor/autoload.php';

use Maantje\Charts\Pie\PieChart;
use Maantje\Charts\Pie\Slice;

$chart = new PieChart(
    size: 500,
    slices: [
        new Slice(
            value: 25,
            color: '#5B9BD5',
            label: 'Sales',
            explodeDistance: 20,
        ),
        new Slice(
            value: 35,
            color: '#ED7D31',
            label: 'Marketing',
        ),
        new Slice(
            value: 20,
            color: '#A5A5A5',
            label: 'Operations',
        ),
        new Slice(
            value: 20,
            color: '#FFC001',
            label: 'Support',
        ),
    ],
);

$svg = $chart->render();
file_put_contents(__DIR__ . '/pie_chart.svg', $svg);
echo $svg;
echo "Pie chart generated successfully: " . __DIR__ . "/pie_chart.svg";
Output:
Conclusion
The PHP SVG Charts library provides a simple and elegant dependency-free way to create SVG charts using PHP. You can easily integrate it into any PHP project for rendering line, bar, grouped bar, and pie charts in seconds. Because it is so lightweight and highly customizable, it is an ideal solution for developers looking for clean charts without front-end complexity.